The Motion Tracker Graph
运动跟踪图

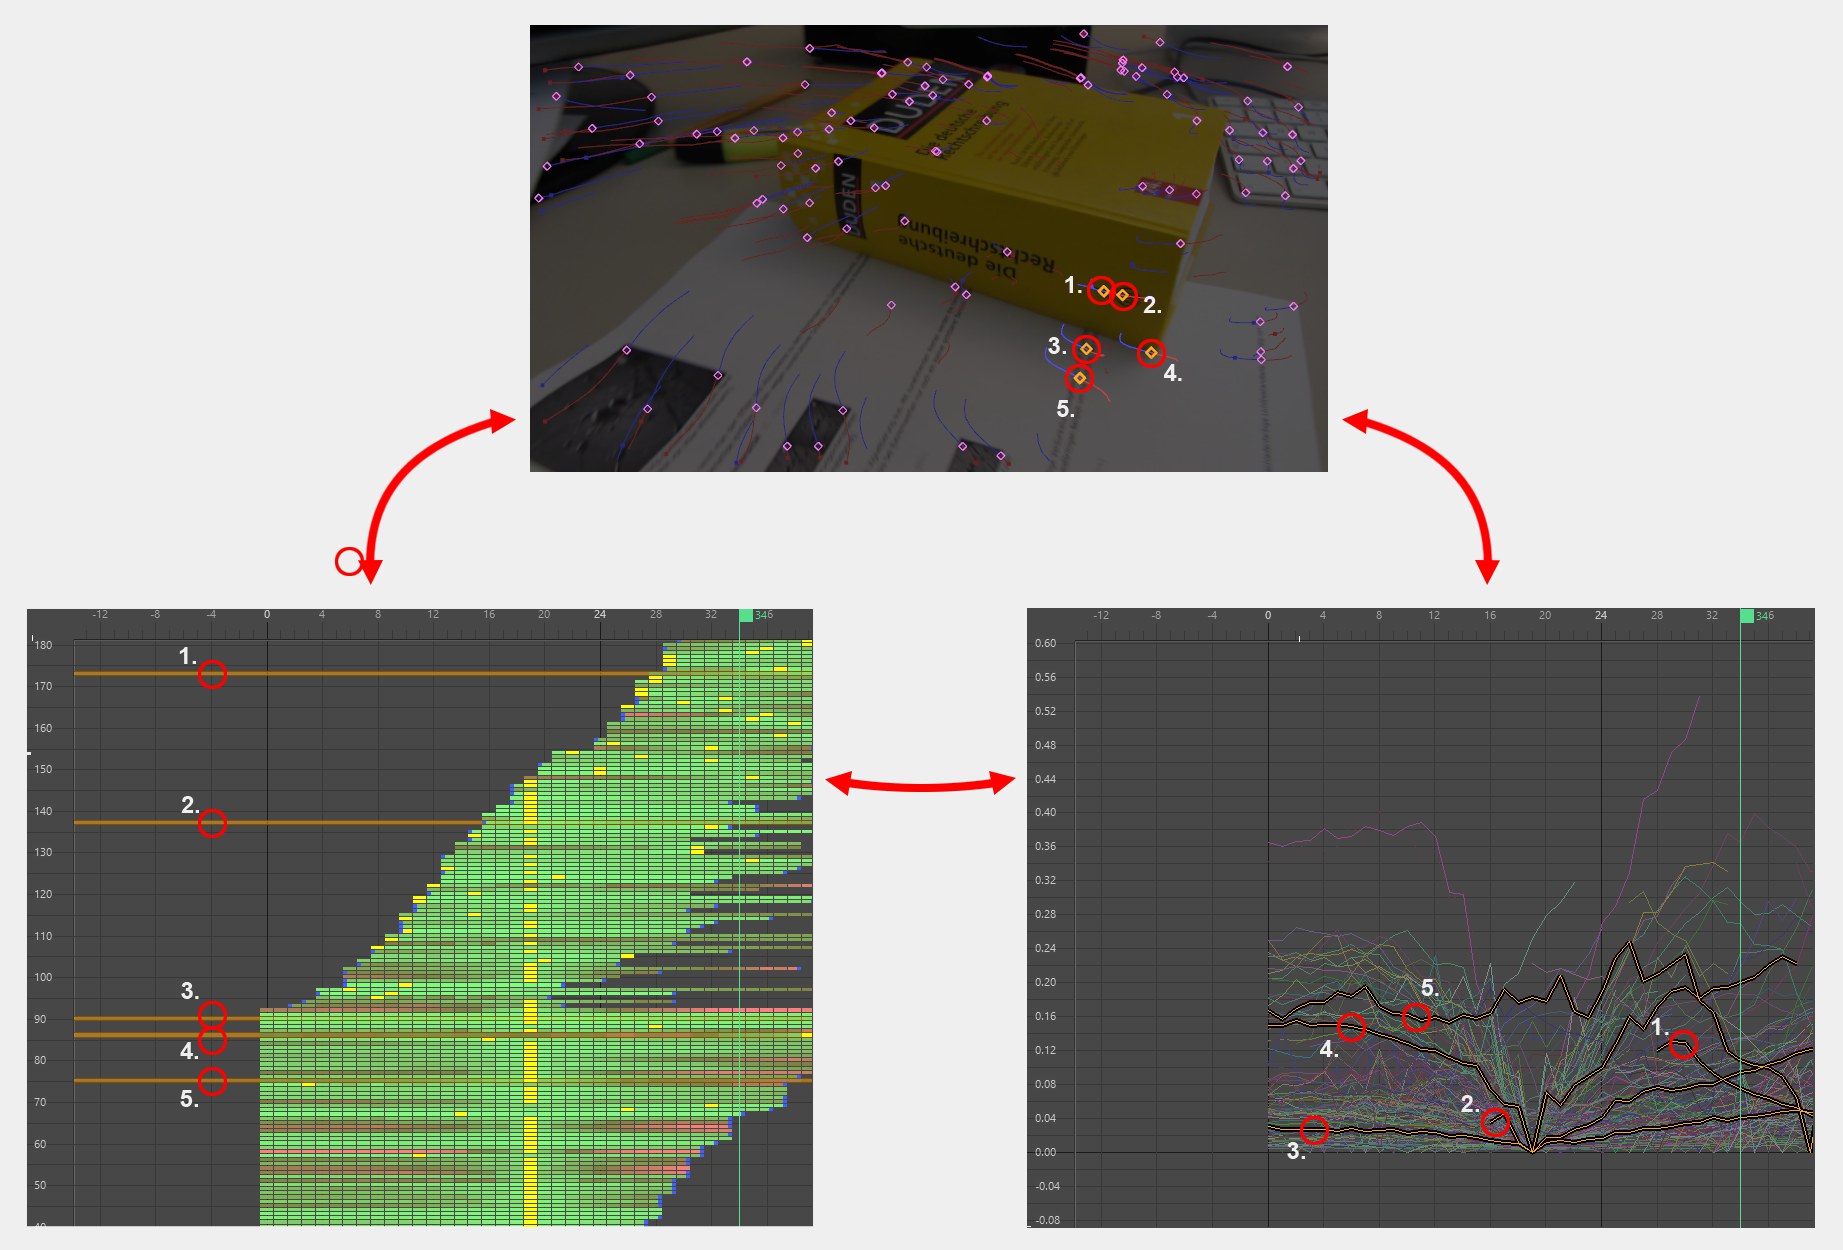
 2 incarnations of the Motion Tracker Graph (left:
Top-Down mode; right: Graph mode). 运动跟踪图的两个版本(左: 自顶向下模式; 右: 图形模式)
2 incarnations of the Motion Tracker Graph (left:
Top-Down mode; right: Graph mode). 运动跟踪图的两个版本(左: 自顶向下模式; 右: 图形模式)
The Motion Tracker Graph (referred to in the following as Graph) is an assistant that provides a visual impression about the quality of both the Auto Tracks and the User Tracks. Imagine the Graph as a simple timeline (but you can only add or delete - but not move - keys) in which Tracks are listed temporally. They are sorted primarily according to their start time and secondarily according to their end time. Note that filtered Auto Tracks will not be displayed.
运动跟踪图(在下面的图中被称为图)是一个助手,它提供了一个关于自动跟踪和用户跟踪质量的视觉印象。把 Graph 想象成一个简单的时间线(但是你只能添加或者删除-但是不能移动-键) ,其中列出了 Tracks。它们主要根据开始时间进行分类,其次根据结束时间进行分类。请注意,筛选后的“自动跟踪”将不会显示。
Normally, bad Tracks (see also What are good and bad Tracks?) are not easily recognizable in the editor unless they are extremely bad. The Graph shows the relative (!) quality in the default 2D Tracking Errors view as follows:
通常情况下,坏的轨道(参见什么是好的和坏的轨道?)在编辑器中不容易识别,除非它们非常糟糕。图表显示了相对值(!)默认的2D 跟踪错误视图的质量如下:
- In 在Top-Down Mode 自顶向下模式: Green regions = better quality; red regions = poor quality. The transition is stepless from green to brown to red. Other colors you will see: yellow (key), gray (shortened Track) and blue, turquoise, purple (filtered Track (due to: smart acceleration, max. acceleration, error threshold), suppressed regions can be found beyond the marks). : 绿色区域 = 质量更好; 红色区域 = 质量差。从绿色到棕色再到红色的过渡是无级的。其他颜色你会看到: 黄色(键) ,灰色(缩短轨道)和蓝色,绿松石,紫色(过滤轨道(由于: 智能加速,最大。加速度,误差阈值) ,抑制区域可以找到以外的标记)
- In 在Graph Mode 图形模式: The greater the graph’s distance from the X axis the poorer the quality of the respective region. 图表与 x 轴的距离越大,各自区域的质量就越差
This does not necessarily mean that red Tracks (or graphs that lie far from the X axis) are bad. It only means
that these Tracks have the greatest number of faults compared to the remaining Tracks (see  2D Tracking
Errors
2D Tracking
Errors
这并不一定意味着红色轨道(或远离 x 轴的图表)是坏的。这只意味着这些轨道与其他轨道相比有最多的故障(参见2D 跟踪错误)。轨道仍然可以正常工作。
If your 3D reconstruction doesn’t work and you have to fine-tune Tracks, red Tracks/high graphs can offer an indication of which Tracks or regions may be problematic. Simply check the red Tracks/high graphs to see if they match the footage. "Rogue" graphs can also be easily recognized in 2D Tracking Speed and 2D Tracking Acceleration modes - but not (!) via a red coloring but by the fact that they diverge from the remaining graphs.
如果你的3D 重建不起作用,你必须微调轨道,红色轨道/高图可以提供哪些轨道或区域可能有问题的指示。只需检查红色的轨道/高图,看看他们是否匹配的镜头。“盗贼”图形也可以很容易地识别在2D 跟踪速度和2D 跟踪加速模式-但没有(!)通过一个红色着色,但事实上,他们偏离了其余的图。
使用
At the top right of each window you will find the already familiar icons for zooming and moving within the
view. Alternatively you can use the hotkeys
在每个窗口的右上角,你会发现已经熟悉的缩放和移动图标。或者你可以使用热键1或 Alt + MMB (移动)或2或 Alt + RMB (缩放)导航。
The green animation slider can be used to navigate through the animation. The slider marks the current location, which, for example, can be used to access commands in the Tracks menu. If you place the cursor over a key or a filter marker, corresponding information will be displayed.
绿色的动画滑块可以用来导航通过动画。滑块标记当前位置,例如,可以用它来访问 Tracks 菜单中的命令。如果您将光标放在键或过滤器标记上,相应的信息将显示出来。
Each selected Track in the editor will also be selected in the Graph and vice-versa.
编辑器中的每个选定轨道也将在图表中选定,反之亦然。
 Track selections are always
synchronized. 音轨选择总是同步的
Track selections are always
synchronized. 音轨选择总是同步的
Tracks can be selected in the Graph using the usual methods, i.e., clicking on them or dragging a selection
box. The
可以使用通常的方法在图中选择曲目,例如,点击曲目或拖动选择框。Shift 和 Ctrl/Cmd 键可以按照通常的方式使用: 轨道将被添加或从选定内容中删除。点击空白区域将取消选中所有。
Only complete Track graphs can be selected.
只能选择完整的轨迹图。
So what can be done with Tracks when they’ve been selected? They can be isolated using the Select menu’s options, which lets you modify only these Tracks (see Tracks after 2D Tracking). Other interactive behavior
in the Graph is restricted to adding and deleting keys and the shortening of Tracks. Selected Tracks can be
deleted via
那么当轨道被选中的时候我们能做些什么呢?它们可以使用选择菜单的选项进行隔离,这样你只能修改这些轨道(参见2D 跟踪后的轨道)。图中的其他交互行为仅限于添加和删除关键字以及缩短曲目。选定的轨道可以删除通过德尔/退格键。
These are all functions that you should be familiar with from working in the editor (see also Tracker menu).
这些都是您在编辑器中工作时应该熟悉的函数(请参阅 Tracker 菜单)。
Note the context menu, which offers a list of familiar commands (see also Tracker menu).
注意上下文菜单,它提供了一个熟悉的命令列表(参见 Tracker 菜单)。
运动跟踪图菜单
Note that several of the commands listed in this menu - namely all of those listed under Tracks or Select - are already listed in the main Tracker menu and are also described in that section.
请注意,本菜单中列出的几个命令——即轨道或选择项下列出的所有命令——已经在主跟踪器菜单中列出,并在该部分中进行了描述。
查看


没有 gridsubframe 每秒精细的中间帧
Use this setting to define how finely and detailed the grid in the window’s background should be displayed.
使用此设置可定义窗口背景中的网格应该显示的精细程度和详细程度。

显示滤镜修剪
If you look closely, you will sometimes see colored markers at the start and end of Tracks when in Top-Down Mode. This option can be used to show or hide these markers. This also affects the visibility of the filter type for keys and the markers.
如果你仔细看,你有时会看到彩色标记的开始和结束轨道时,在自顶向下模式。此选项可用于显示或隐藏这些标记。这也会影响键和标记的过滤器类型的可见性。

自顶向下模式
This default mode lists all Tracks in temporal order. The order is as follows: The Tracks will be sorted primarily according to start time and secondarily according to end time from bottom (y=0) to top, i.e., Tracks that appear first will be arranged at the bottom and Tracks that come later will be arranged accordingly towards the top. This means that Tracks that were edited can suddenly be arranged differently. We recommend isolating the Tracks you want to edit (Select menu).
此默认模式按时间顺序列出所有音轨。顺序如下: 轨道将主要按照开始时间排序,其次是按照从底部(y = 0)到顶部的结束时间排序,也就是说,首先出现的轨道将被安排在底部,后来出现的轨道将相应地安排在顶部。这意味着编辑过的歌曲可以突然以不同的方式排列。我们建议隔离您想要编辑的轨道(选择菜单)。
In this mode you have a better overview over the number of Tracks, length of Tracks, Tracks per frame, etc.
在这种模式下,你可以更好地了解音轨的数量,音轨的长度,每帧音轨等等。

图形模式
When in Graph Mode, all Tracks (which will be displayed below) will be displayed as graphs, whereby the values in the menu at the bottom will be applied to the Y axis. When in this mode it is especially easy to determine which graphs deviate the most.
当在图形模式,所有轨道(这将显示在下面)将显示为图形,即菜单中的值在底部将适用于 y 轴。在这种模式下,特别容易确定哪些图偏离最大。
2 d 跟踪错误
In this default mode, each Track’s errors will be displayed.
在此默认模式下,将显示每个 Track 的错误。
An ,error’ in this case is a mathematical value that represents the current deviation of the Track from the image detail saved in the foregoing keyframe (detailed information about Tracks can be found here).
在这种情况下,‘ error’是一个数学值,表示当前 Track 与前面关键帧中保存的图像细节的偏差(Tracks 的详细信息可以在此处找到)。
Take a look at the following, quite typical, Track:
让我们来看看下面这个典型的 Track:
 The course of a typical Track. At left with one
keyframe, at right with a subsequently added second keyframe. 一个典型的跟踪过程。左边有一个关键帧,右边有一个随后添加的第二个关键帧
The course of a typical Track. At left with one
keyframe, at right with a subsequently added second keyframe. 一个典型的跟踪过程。左边有一个关键帧,右边有一个随后添加的第二个关键帧
The error for one keyframe is zero - which is because there are no deviations at that location. However, the farther from the keyframe the graph is, the greater the error (=deviation from the image detail saved in the key) will be that changes with each frame. If a second keyframe is added, the error at that location will again be zero and again increase as the graph continues. Hence, you can suppress an error by adding keys (or fine-tuning existing keys).
一个关键帧的错误是零,这是因为在该位置没有偏差。但是,图离关键帧越远,每帧图像的变化带来的误差(= 与保存在关键帧中的图像细节的偏差)就越大。如果添加第二个关键帧,该位置的错误将再次为零,并且随着图形的继续而增加。因此,您可以通过添加键(或微调现有键)来抑制错误。
In Top-Down Mode, each error will be displayed in color for each image, as described here.
在自顶向下模式下,每个错误将以颜色显示每个图像,如下所述。

2 d 跟踪速度
This mode displays the velocity of the Tracks in the editor. This view works best in Graph Mode.
这个模式在编辑器中显示轨迹的速度。这个视图在图形模式下工作得最好。

Graphs all run more-or-less ,parallel’. We’ll use a camera movement as an example: If the camera pans with a high velocity, the Tracks will move correspondingly fast and the graphs will be positioned correspondingly high at that location. If individual tracks deviate greatly from the rest (as shown in the image) then these are most likely faulty.
图表都运行或多或少,平行’。我们将以摄像机移动为例: 如果摄像机以高速移动,轨迹将相应地快速移动,图形将相应地高位于该位置。如果个别轨迹与其他轨迹相差很大(如图所示) ,那么这些轨迹极有可能是错误的。
The Tracks will be colored according to their velocity in Top-Down Mode: green=fastest; red=slowest.
轨道将根据它们在自顶向下模式下的速度着色: 绿色 = 最快; 红色 = 最慢。

2 d 跟踪加速
This mode displays the acceleration of the Tracks in the editor. This view works best in Graph Mode.
此模式在编辑器中显示轨道的加速。此视图在图形模式下工作得最好。

This view lets you locate individual Tracks that have a high velocity (i.e., Tracks that jump). These are almost always faulty. If the Motion Tracker object’s Maximum Acceleration option is enabled (2D Tracking tab), this threshold value will be displayed here. This value corresponds to the filter setting, which means that it can be moved vertically to filter out deviate graphs.
此视图允许您定位具有高速度的单个轨道(例如,跳转的轨道)。这些几乎都是错误的。如果启用了运动跟踪器对象的最大加速度选项(2D 跟踪选项卡) ,这个阈值将显示在这里。这个值对应于过滤器设置,这意味着它可以垂直移动以过滤出偏离图。
The Tracks will be colored according to their velocity in Top-Down Mode: green=fastest; red=slowest.
轨道将根据它们在自顶向下模式下的速度着色: 绿色 = 最快; 红色 = 最慢。
导航

全部框架
This is the command that you will probably call up right after opening the Motion Tracker Graph - it lets you zoom and move all visible Tracks so they fill the window completely.
这是命令,你可能会调用后,立即打开运动跟踪图-它让你放大和移动所有可见的轨道,使他们填补了窗口完全。

选择框架
This command zooms and moves all selected Tracks so they fill the window completely.
这个命令缩放和移动所有选择的轨道,使他们填充窗口完全。

转到当前帧
Adjusts the view so the timeslider is in the center.
调整视图,使时间限制在中心。